Class: AP3 | Unit: Unknown | Updated: 2026-02-09
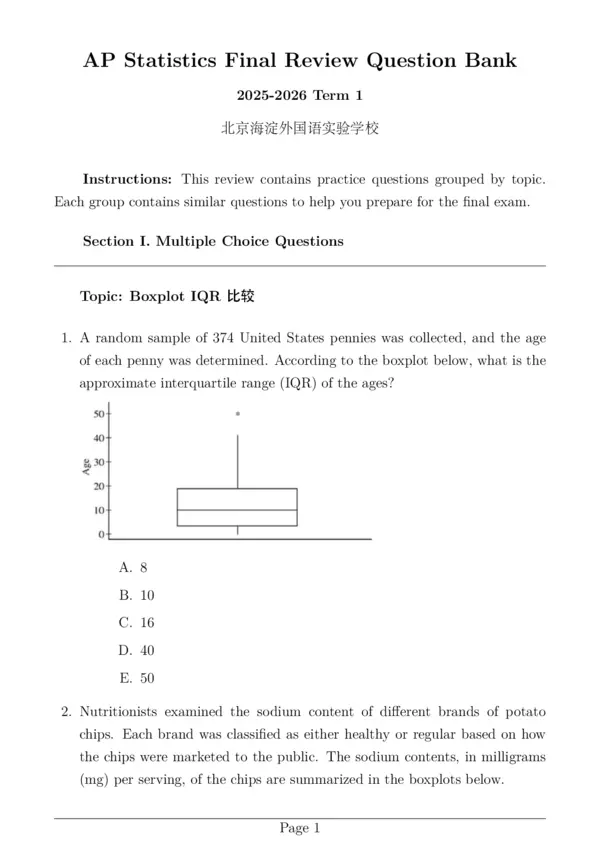
AP Statistics Final Review Question Bank 2025-2026 Term 1 北京海淀外国语实验学校 Instructions: This review contains practice questions grouped by topic. Each group contains similar questions to help you prepare for the final exam. Section I. Multiple Choice Questions Topic: Boxplot IQR 比较 1. A random sample of 374 United States pennies was collected, and the age of each penny was determined. According to the boxplot below, what is the approximate interquartile range (IQR) of the ages? Age 50+ 40+ 30- * 20 10+ 0 A. 8 B. 10 C. 16 D. 40 Ε. 50 2. Nutritionists examined the sodium content of different brands of potato chips. Each brand was classified as either healthy or regular based on how the chips were marketed to the public. The sodium contents, in milligrams (mg) per serving, of the chips are summarized in the boxplots below. Page 1 AP Statistics Regular Chips Healthy Chips 75 100 125 150 175 2025-2026 Term 1 Review Question Bank 200 225 250 275 300 Sodium Content (mg) Based on the boxplots, which statement gives a correct comparison between the two classifications of the sodium content of the chips? A. The number of brands classified as healthy is greater than the number of brands classified as regular. B. The interquartile range (IQR) of the brands classified as healthy is greater than the IQR of the brands classified as regular. C. The range of the brands classified as healthy is less than the range of the brands classified as regular. D. The median of the brands classified as healthy is more than twice the median of the brands classified as regular. E. The brand with the least sodium content and the brand with the greatest sodium content are both classified as healthy. Height (centimeters) 250- 200- 150 100- 50- 中中 ** 0 Fertilized * Unfertilized The figure above summarizes the heights, in centimeters, of approximately 400 pine seedlings six years after they were planted at a center for environ- mental study. Approximately half of the trees were fertilized yearly, and the remaining trees were never fertilized. Which of the following statements about the medians and interquartile ranges (IQRs) of the heights of the two groups of trees 6 years after being planted is true? Page 2 AP Statistics 2025-2026 Term 1 Review Question Bank A. The medians and IQRs are the same for the unfertilized trees and the fertilized trees. B. The median for the unfertilized trees is greater than the median for the fertilized trees, and the IQR is also greater for the unfertilized trees. C. The median for the unfertilized trees is the same as the median for the fertilized trees, and the IQR is greater for the unfertilized trees. D. The median for the unfertilized trees is less than the median for the fertilized trees, and the IQR is greater for the unfertilized trees. E. The median for the unfertilized trees is less than the median for the fertilized trees, and the IQR is less for the unfertilized trees. 3. An airline recorded the number of on-time arrivals for a sample of 100 flights each day. The boxplot below summarizes the recorded data for one year. 70 80 90 Number of On-Time Arrivals 100 Based on the boxplot, which of the following statements must be true? A. The range of the number of on-time arrivals is greater than 90 . B. The interquartile range of the number of on-time arrivals is 22. C. The number of days that had at least 80 on-time arrivals is greater than the number of days that had at most 76 on-time arrivals. D. The number of days that had from 76 to 80 on-time arrivals is equal to the number of days that had at most 76 on-time arrivals. E. The difference between the median and the lower quartile for the number of on-time arrivals is less than 2. Page 3 AP Statistics 2025-2026 Term 1 Review Question Bank 4. A sociologist collected data from a sample of people on their highest level of education and the number of times they visited any fast food restaurant during the previous week. The data are summarized in the boxplots. High school Community college Four-year college More than four-year college VISITS BY HIGHEST EDUCATION LEVEL 0 1 + 2 3 Number of Visits 4 5 Based on the boxplots, which of the following statements must be true? A. The number of people surveyed at the more than four-year college level is greater than the number of people surveyed at the high school level. B. The proportion of people surveyed from the first quartile to the third quartile at the four-year college level is less than the respec- tive proportion at the community college level. C. The interquartile range (IQR) for the number of visits at the more than four-year college level is less than the IQR for the number of visits at the community college level. D. The maximum number of visits at the community college level is greater than the maximum number of visits at the high school level. E. The median number of visits at the four-year college level is greater than the median number of visits at the high school level. Topic: Histogram IQR 估算 5. A marketing firm obtained random samples of 20 people in five regions of the country to investigate the level of interest in a new product. People in Page 4 AP Statistics 2025-2026 Term 1 Review Question Bank , the sample were asked to rate their level of interest on a scale from 1 to 10 with 1 being the least amount of interest and 10 being the greatest. The histograms show the results for each region. The graph for which region displays data for level of interest with the least standard deviation? Region A A. Frequency 8+ 6- 4 2 0 1 2 3 4 5 6 7 8 9 10 Level of Interest Region B B. Frequency 8+ 6- 4- 2 0 1 2 3 4 5 6 7 8 9 10 Level of Interest Page 5 AP Statistics 2025-2026 Term 1 Review Question Bank Region C C. Frequency 8+ 6- 4- 2 0 1 2 3 4 5 6 7 8 9 10 Level of Interest Region D D. Frequency 8+ 6+ 4+ 2 0 1 2 3 4 5 6 7 8 9 10 Level of Interest Page 6 AP Statistics 2025-2026 Term 1 Review Question Bank Region E E. Frequency 8- 6 4- 2 0 1 2 3 4 5 6 7 8 9 10 Level of Interest 6. The histogram shown summarizes the responses of 100 people when asked,